Інформаційна панель Grafana
Prerequisites
First install Grafana and Prometheus on your machine.
Ви також можете використовувати [Grafana Cloud] (https://grafana.com/products/cloud/) замість того, щоб встановлювати його локально.
Увімкнути метрики
Щоб увімкнути метрики, вам потрібно змінити аргументи CLI вашої ноди і фармера, додавши опцію Prometheus:
для ноди:
--prometheus-listen-on 127.0.0.1:9080
для фармера:
--prometheus-listen-on 127.0.0.1:9081
To apply the changes, it's necessary to restart your node and farmer. You should then have the capability to reach the metrics at http://localhost:9080/metrics and http://localhost:9081/metrics.
Налаштування цілей Prometheus
Locate the prometheus.yml file and add the following job entry under the scrape_configs section:
- job_name: "subspace"
  static_configs:
    - targets: ["localhost:9080"]
      labels:
        group: 'node'
    - targets: ["localhost:9081"]
      labels:
        group: 'farmer'
On Linux machines, you can typically find the prometheus.yml file at the following path: /etc/prometheus/prometheus.yml
Restart Prometheus with the new configuration.
Prometheus can reload its configuration without restarting by using the SIGHUP signal. If you're running on Linux this can be performed by using kill -s SIGHUP <PID>, replacing <PID> with your Prometheus process ID.
Налаштування Grafana
By default, Grafana usually runs on port 3000. You can access Grafana by navigating to the following URL: http://localhost:3000.
The default username and password is admin.
Add your Prometheus Data Source:
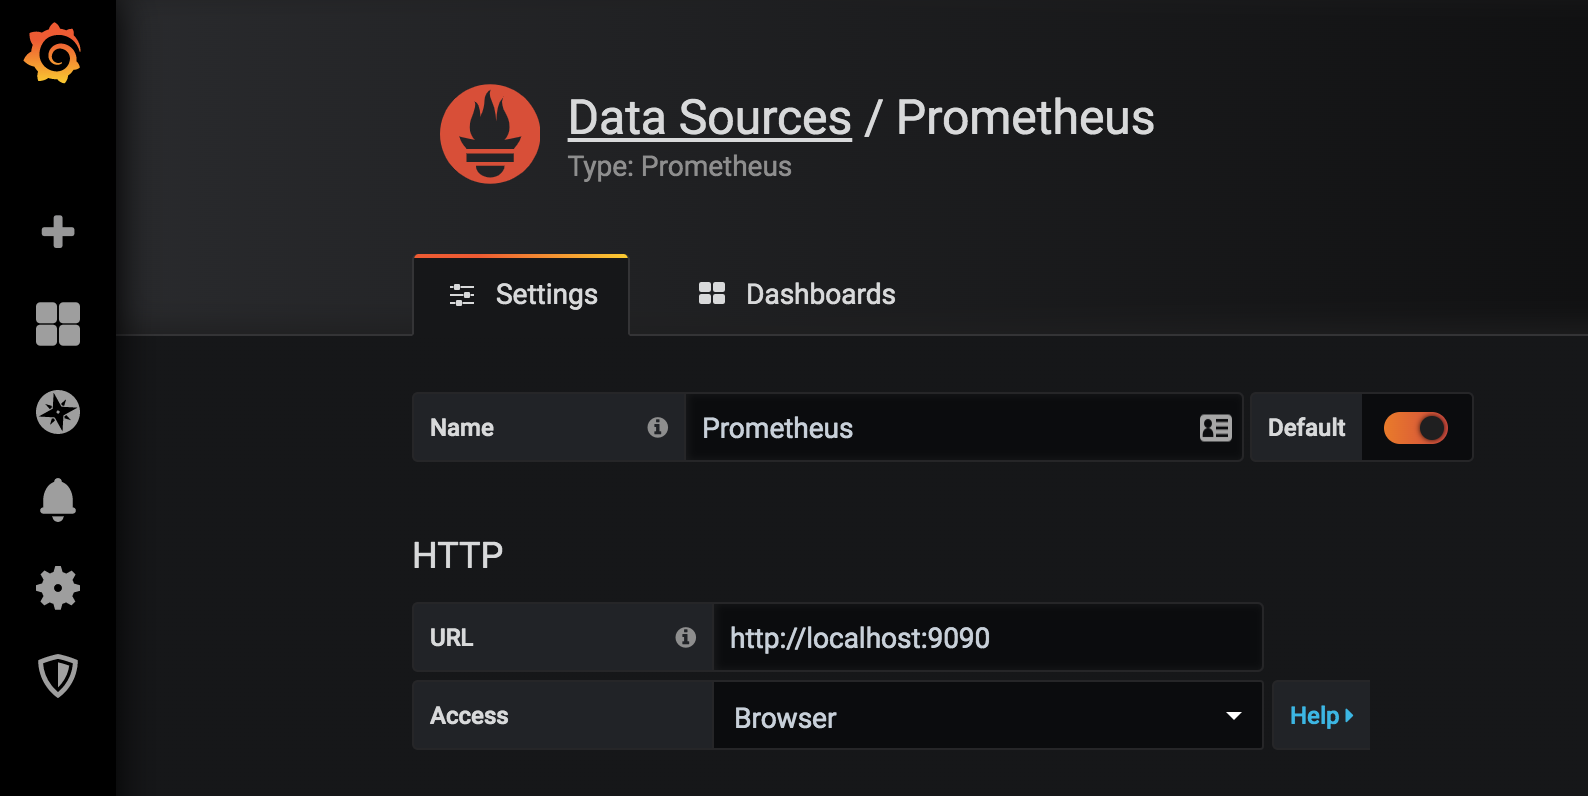
Click Save & test to test the configuration, if everything is alright you'll see the green message "Data source is working".
Import Grafana dashboard
Copy and paste the Grafana Dashboard ID 20433 and click Load to complete importing:
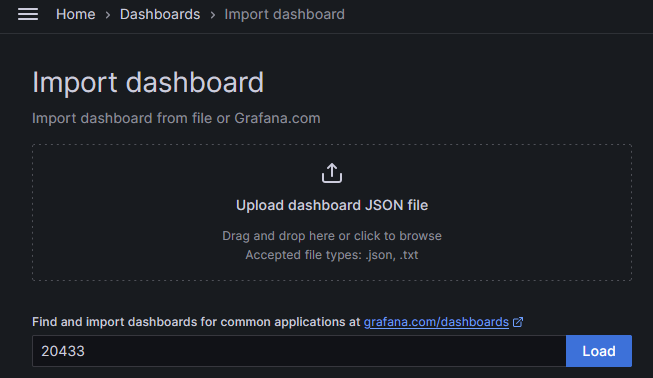
Select your Prometheus as Data Source and click Import.
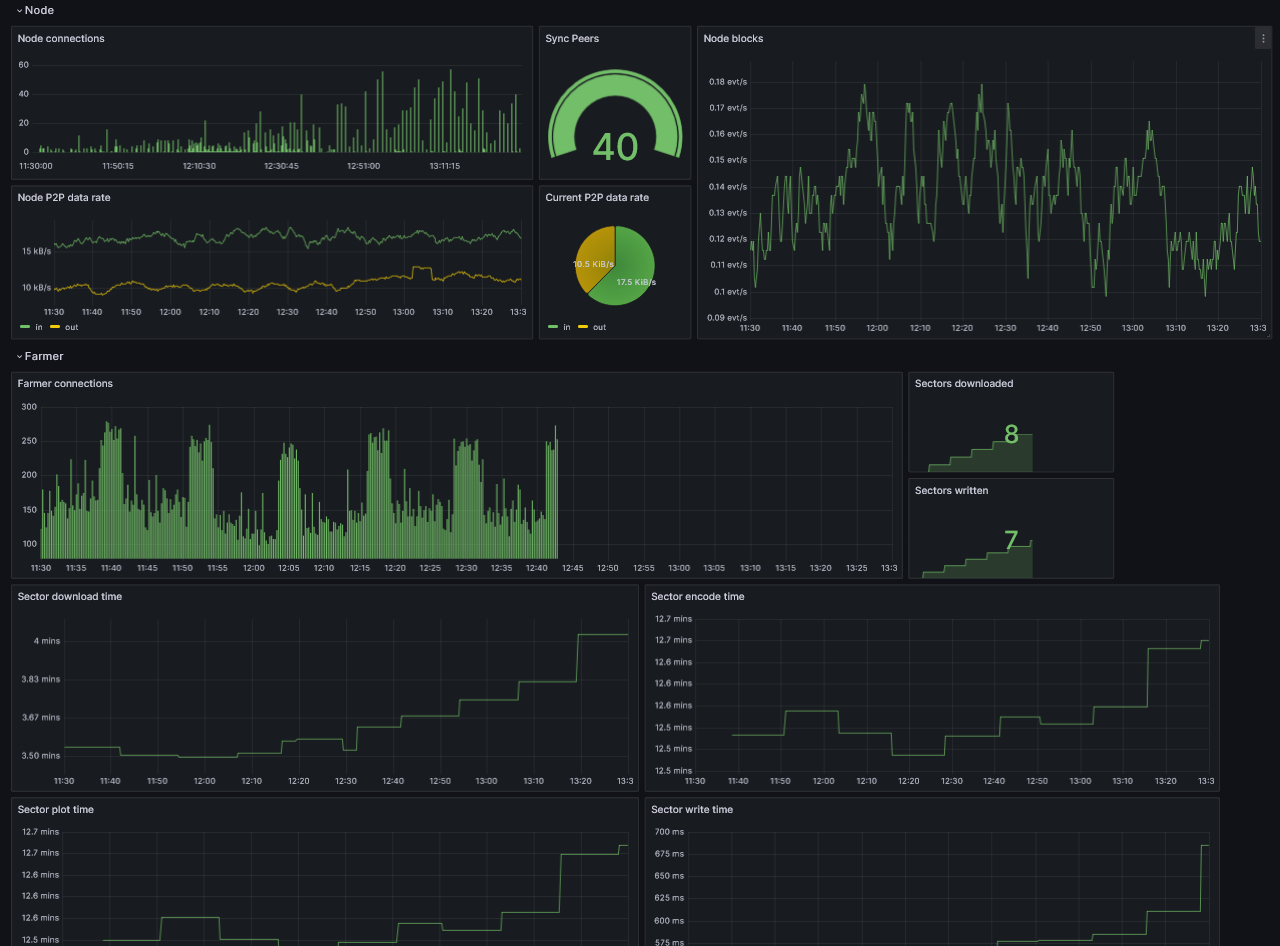
At this point, you should be able to monitor your node.
Monitoring Node Sync & Cache Recovery
When restarting a node or farmer after an extended offline period, the system must rebuild its local cache and sync outstanding data with the network history.
Key Metrics to Track during Recovery
- Block Sync Speed: Monitor the gap between your local block height and the global network target. A steady increase indicates active catch-up.
- Source: Node (
substrate-node) - Prometheus Metrics:
substrate_block_height{type="best"}(local height) andsubstrate_block_height{type="target"}(network target). - PromQL Gap Example:
substrate_block_height{type="target"} - substrate_block_height{type="best"}
- Source: Node (