Grafana Dashboard
Prerequisites
First install Grafana and Prometheus on your machine.
Sie können auch Grafana Cloud verwenden, anstatt es lokal zu installieren.
Aktivieren Sie Metriken
Um Metriken zu aktivieren, müssen Sie die CLI-Argumente Ihres Knotens und Farmers ändern, indem Sie die Option Prometheus hinzufügen:
für einen Knoten:
--prometheus-listen-on 127.0.0.1:9080
für einen Farmer:
--prometheus-listen-on 127.0.0.1:9081
To apply the changes, it's necessary to restart your node and farmer. You should then have the capability to reach the metrics at http://localhost:9080/metrics and http://localhost:9081/metrics.
Konfigurieren von Prometheus-Zielen
Suchen Sie die Datei prometheus.yml und fügen Sie den folgenden Job-Eintrag im Abschnitt scrape_configs hinzu:
- job_name: "subspace"
  static_configs:
    - targets: ["localhost:9080"]
      labels:
        group: 'node'
    - targets: ["localhost:9081"]
      labels:
        group: 'farmer'
Auf Linux-Rechnern finden Sie die Datei prometheus.yml normalerweise unter folgendem Pfad: /etc/prometheus/prometheus.yml
Starten Sie Prometheus mit der neuen Konfiguration neu.
Prometheus can reload its configuration without restarting by using the SIGHUP signal. If you're running on Linux this can be performed by using kill -s SIGHUP <PID>, replacing <PID> with your Prometheus process ID.
Konfigurieren Sie Grafana
By default, Grafana usually runs on port 3000. You can access Grafana by navigating to the following URL: http://localhost:3000.
Der Standardbenutzername und das Standardkennwort lauten „admin“.
Fügen Sie Ihre Prometheus-Datenquelle hinzu:
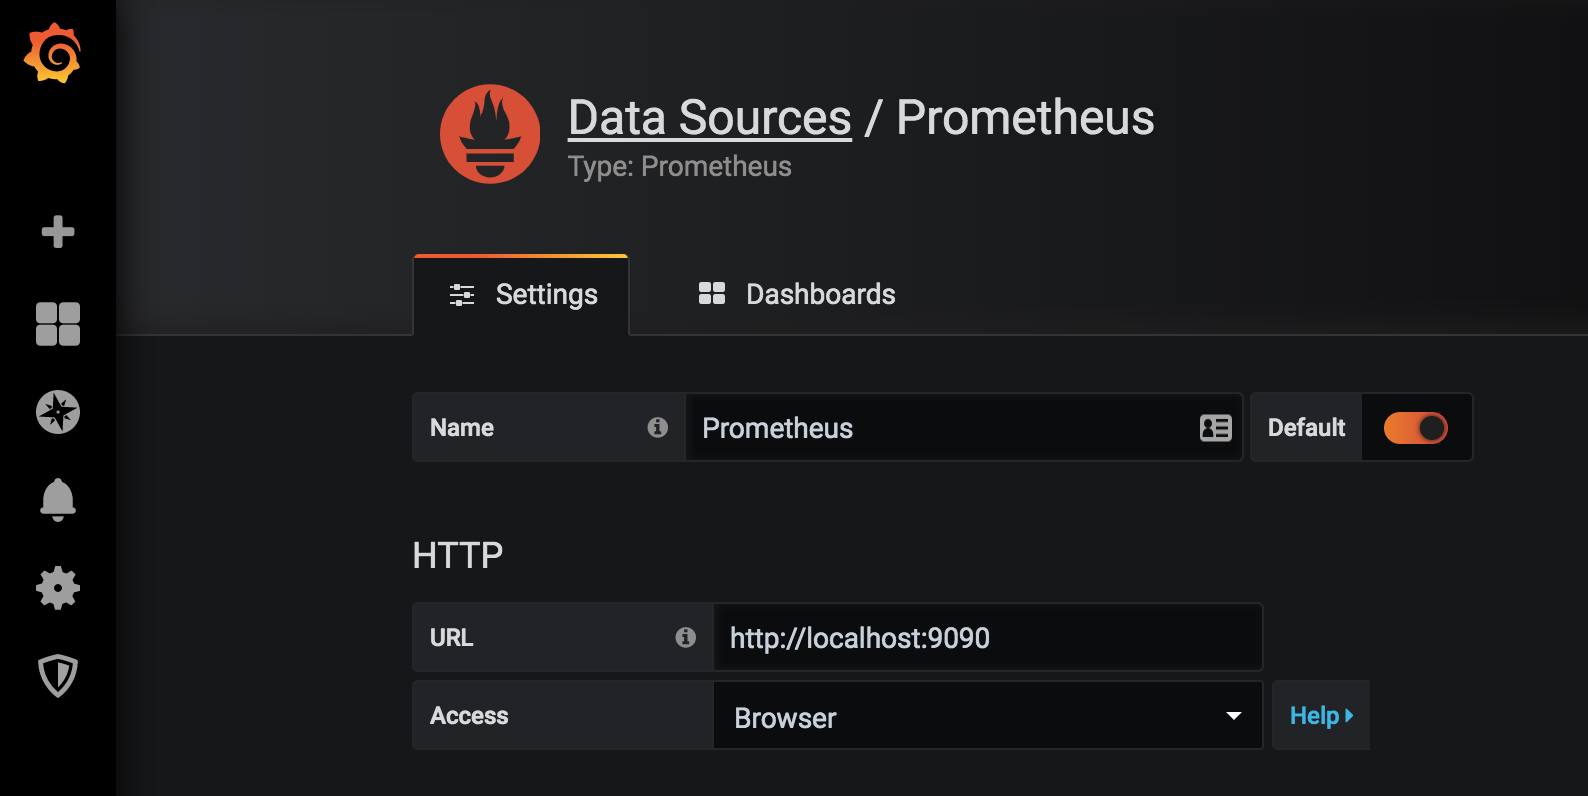
Klicken Sie auf Speichern und testen, um die Konfiguration zu testen. Wenn alles in Ordnung ist, wird die grüne Meldung „Datenquelle funktioniert“ angezeigt.
Importieren Sie das Grafana-Dashboard
Kopieren Sie die Grafana Dashboard-ID 20433 und fügen Sie sie ein. Klicken Sie auf Laden, um den Import abzuschließen:
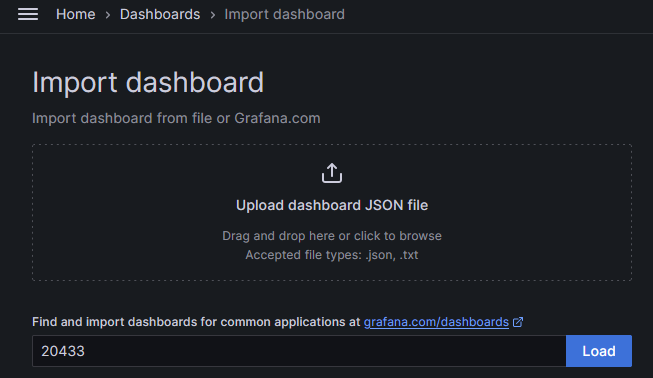
Wählen Sie Prometheus als Datenquelle aus und klicken Sie auf Importieren.
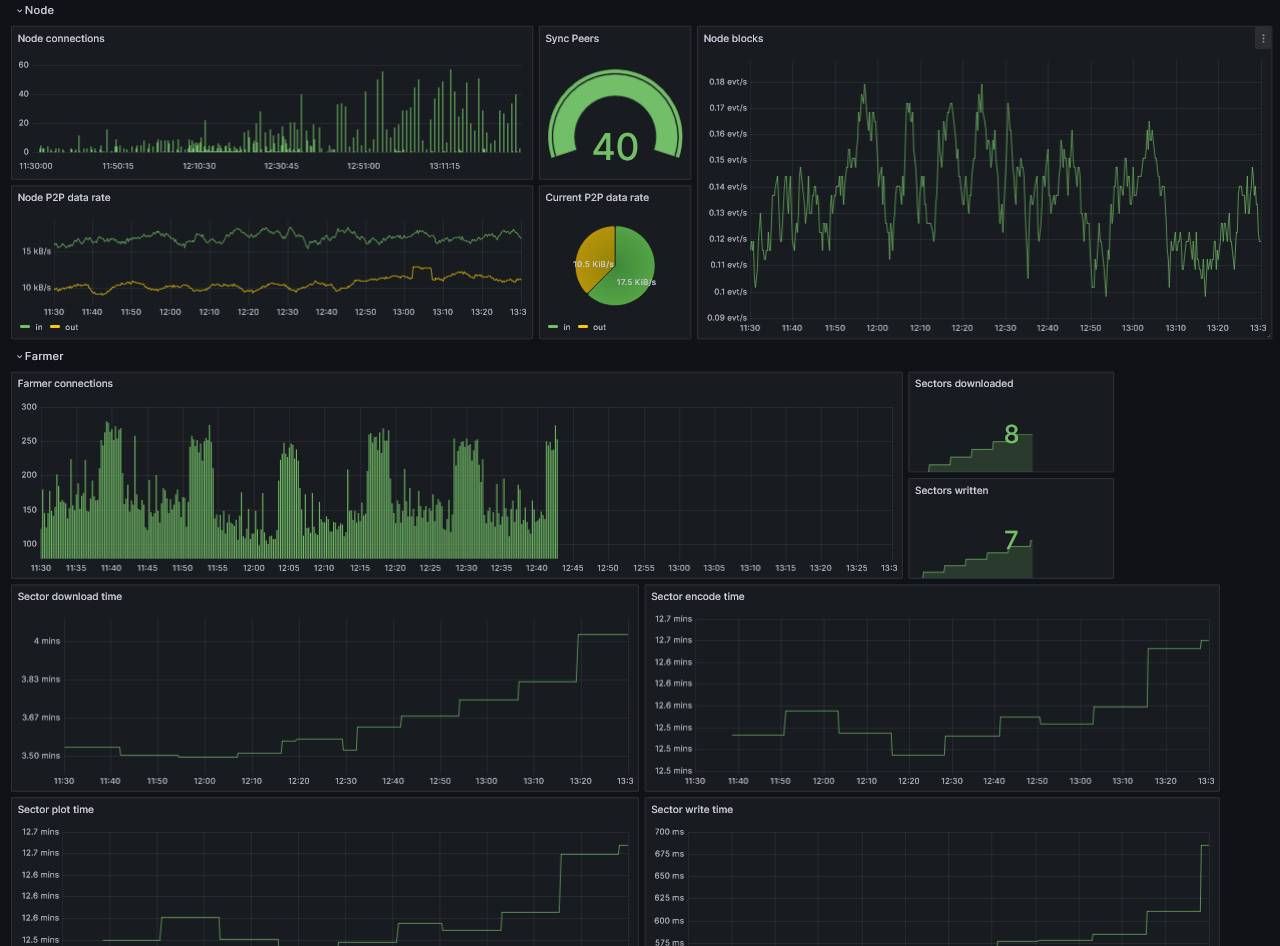
An diesem Punkt sollten Sie in der Lage sein, Ihren Knoten zu überwachen.
Monitoring Node Sync & Cache Recovery
When restarting a node or farmer after an extended offline period, the system must rebuild its local cache and sync outstanding data with the network history.
Key Metrics to Track during Recovery
- Block Sync Speed: Monitor the gap between your local block height and the global network target. A steady increase indicates active catch-up.
- Source: Node (
substrate-node) - Prometheus Metrics:
substrate_block_height{type="best"}(local height) andsubstrate_block_height{type="target"}(network target). - PromQL Gap Example:
substrate_block_height{type="target"} - substrate_block_height{type="best"}
- Source: Node (