Grafana 仪表盘
先决条件
首先在您的机器上安装 Grafana 和 Prometheus。
除了本地安装,您也可以使用 Grafana Cloud
启用指标
要启用指标,您必须修改节点和农民的命令行参数添加 Prometheus 选项
针对节点:
--prometheus-listen-on 127.0.0.1:9080
针对农民:
--prometheus-listen-on 127.0.0.1:9081
To apply the changes, it's necessary to restart your node and farmer. You should then have the capability to reach the metrics at http://localhost:9080/metrics and http://localhost:9081/metrics.
配置 Prometheus 目标
找到prometheus.yml文件,并在scrape_configs区域中添加以下作业项:
- job_name: "subspace"
  static_configs:
    - targets: ["localhost:9080"]
      labels:
        group: 'node'
    - targets: ["localhost:9081"]
      labels:
        group: 'farmer'
在 Linux 机器上,你通常可以在 /etc/prometheus/prometheus.yml 路径下找到prometheus.yml 文件。
使用新配置重新启动Prometheus。
Prometheus can reload its configuration without restarting by using the SIGHUP signal. If you're running on Linux this can be performed by using kill -s SIGHUP <PID>, replacing <PID> with your Prometheus process ID.
配置 Grafana
By default, Grafana usually runs on port 3000. You can access Grafana by navigating to the following URL: http://localhost:3000.
默认用户名和密码是 admin。
添加您的 Prometheus 数据源:
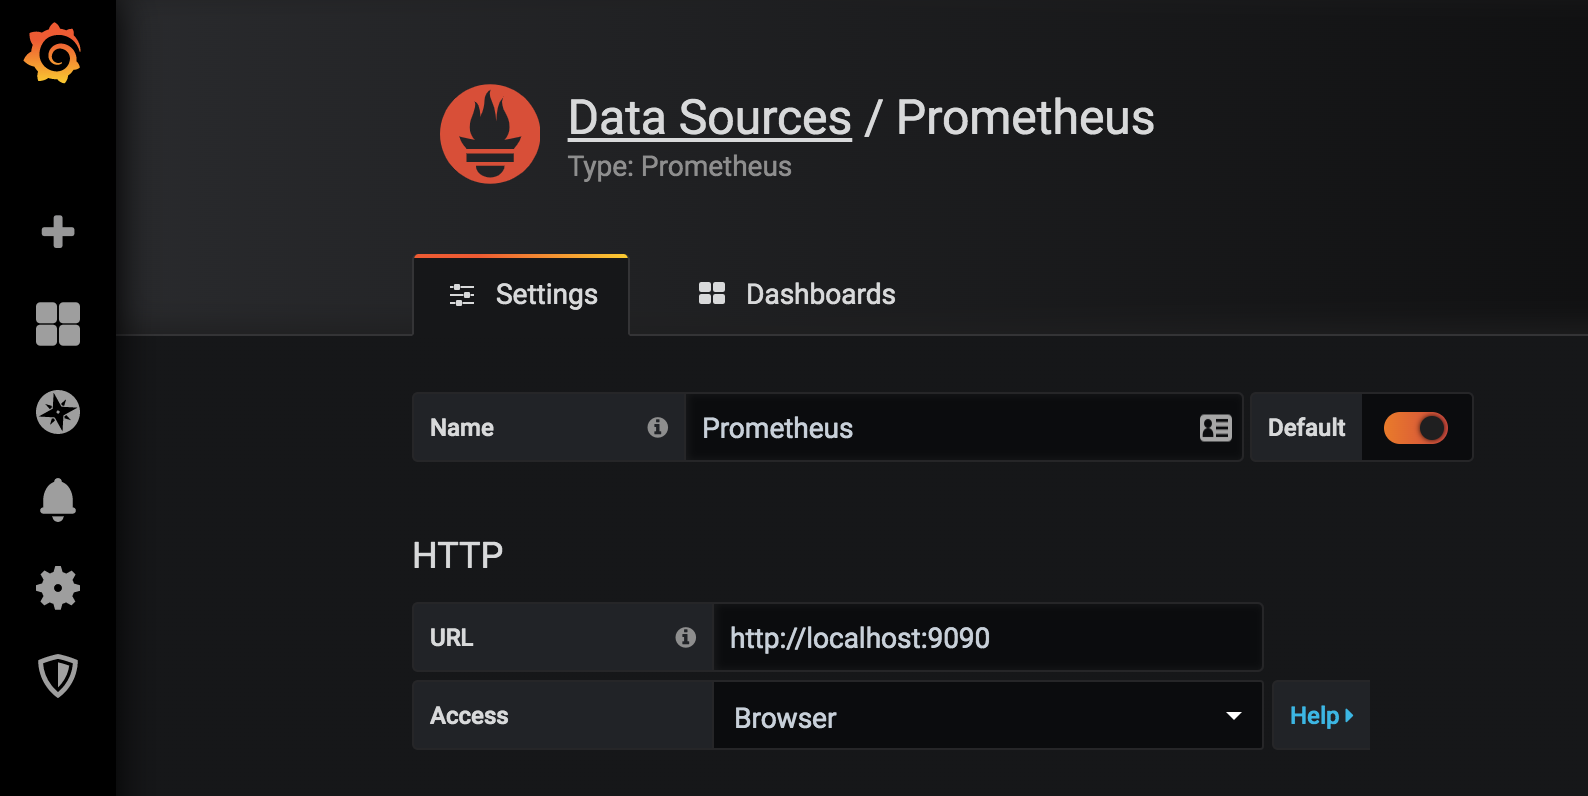
点击“保存并测试”来测试配置,如果一切都正确,您将看到绿色消息“数据源正常工作”。
导入 Grafana 仪表板
复制并粘贴Grafana 仪表盘ID 20433 并点击Load 完成导入:
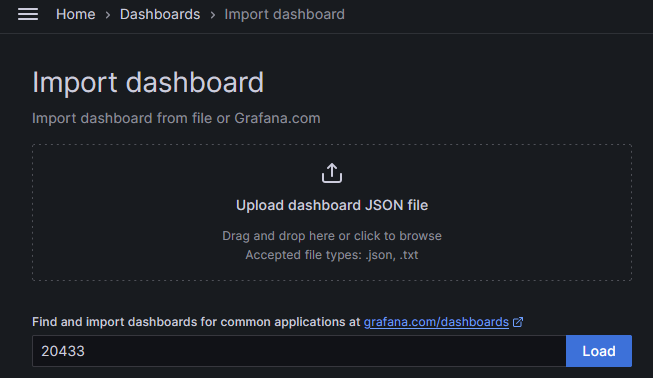
选择您的Prometheus作为数据源,然后点击导入。
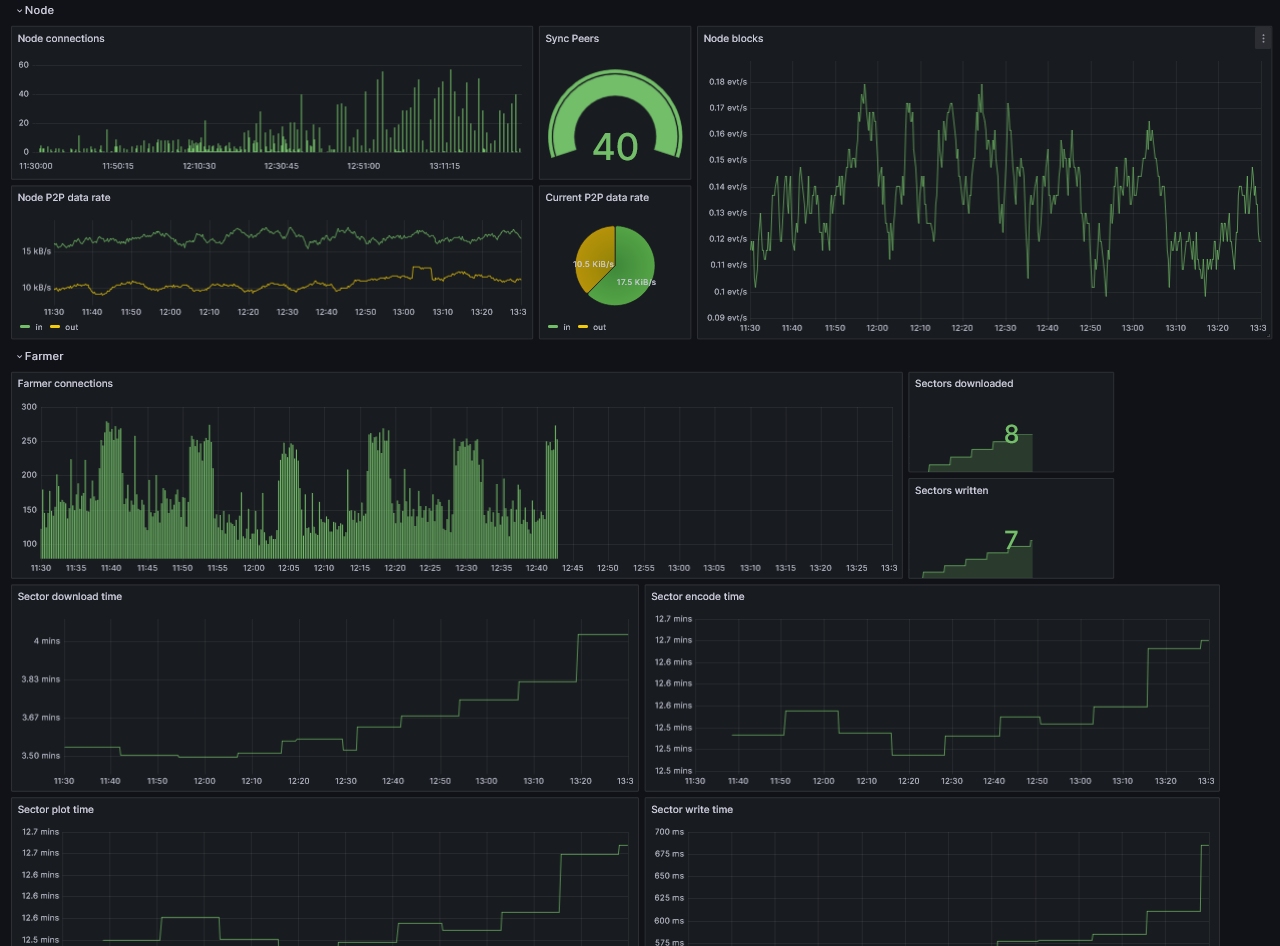
此时,您应该能够监控到您的节点了。
Monitoring Node Sync & Cache Recovery
When restarting a node or farmer after an extended offline period, the system must rebuild its local cache and sync outstanding data with the network history.
Key Metrics to Track during Recovery
- Block Sync Speed: Monitor the gap between your local block height and the global network target. A steady increase indicates active catch-up.
- Source: Node (
substrate-node) - Prometheus Metrics:
substrate_block_height{type="best"}(local height) andsubstrate_block_height{type="target"}(network target). - PromQL Gap Example:
substrate_block_height{type="target"} - substrate_block_height{type="best"}
- Source: Node (