Панель управления Grafana
Требования
Сначала установите Grafana и Prometheus на ваш компьютер.
Вы также можете использовать Grafana Cloud вместо локальной установки.
Включение метрик
Чтобы включить метрики, вам придется изменить аргументы CLI вашего узла и фермера, добавив опцию Prometheus:
для узла:
--prometheus-listen-on 127.0.0.1:9080
для фармера:
--prometheus-listen-on 127.0.0.1:9081
Чтобы применить изменения, необходимо перезагрузить ваш узел и фармер. Теперь у Вас должна быть возможность получить доступ к метрикам по адресам http://localhost:9080/metrics и http://localhost:9081/metrics.
Настройка целей для Prometheus
Найдите файл prometheus.yml и добавьте следующую запись задания в раздел scrape_configs:
- job_name: "subspace"
  static_configs:
    - targets: ["localhost:9080"]
      labels:
        group: 'node'
    - targets: ["localhost:9081"]
      labels:
        group: 'farmer'
На машинах Linux вы обычно можете найти файл prometheus.yml по следующему пути: /etc/prometheus/prometheus.yml
Перезапустите Prometheus с новой конфигурацией.
Prometheus может перезагрузить свою конфигурацию без перезапуска, используя сигнал SIGHUP. Если вы работаете на Linux, это можно выполнить с помощью kill -s SIGHUP <PID>, заменив <PID> на ID вашего процесса Prometheus.
Настройка Grafana
По умолчанию, Grafana обычно работает на порту 3000. Вы можете получить доступ к Grafana, перейдя по следующему URL: http://localhost:3000.
Имя пользователя и пароль по умолчанию - admin.
Добавьте ваш источник данных Prometheus:
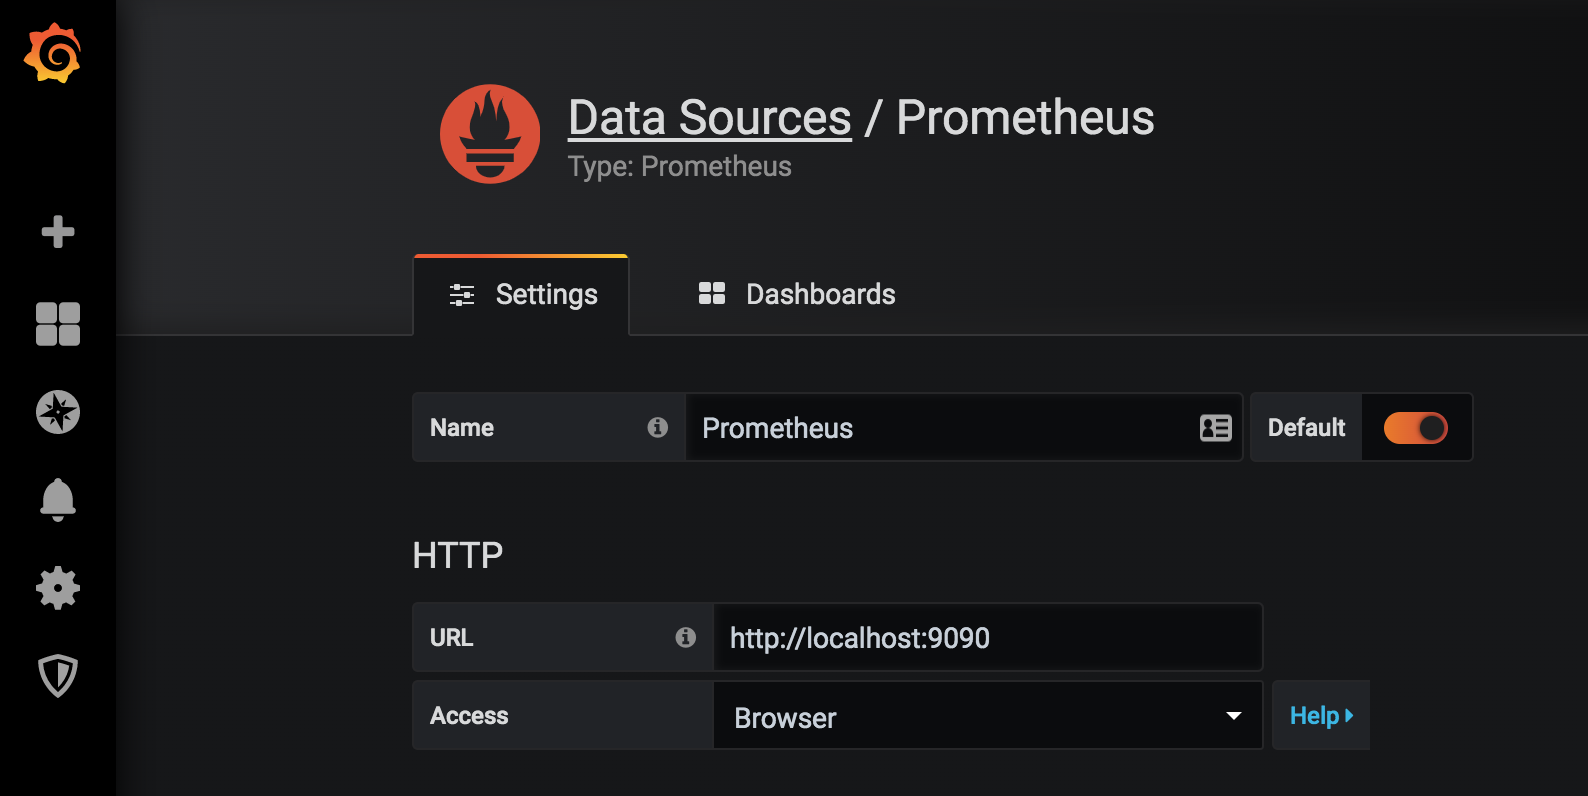
Нажмите Сохранить и проверить для проверки конфигурации, если всё в порядке, вы увидите зеленое сообщение "Источник данных работает".
Импорт дашбордов в Grafana
Скопируйте и вставьте ID панели Grafana 20433 и нажмите Загрузить, чтобы завершить импорт:
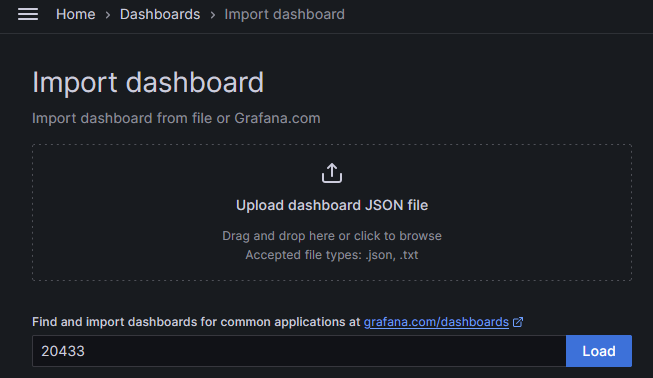
Выберите Prometheus в качестве источника данных и нажмите Импорт.
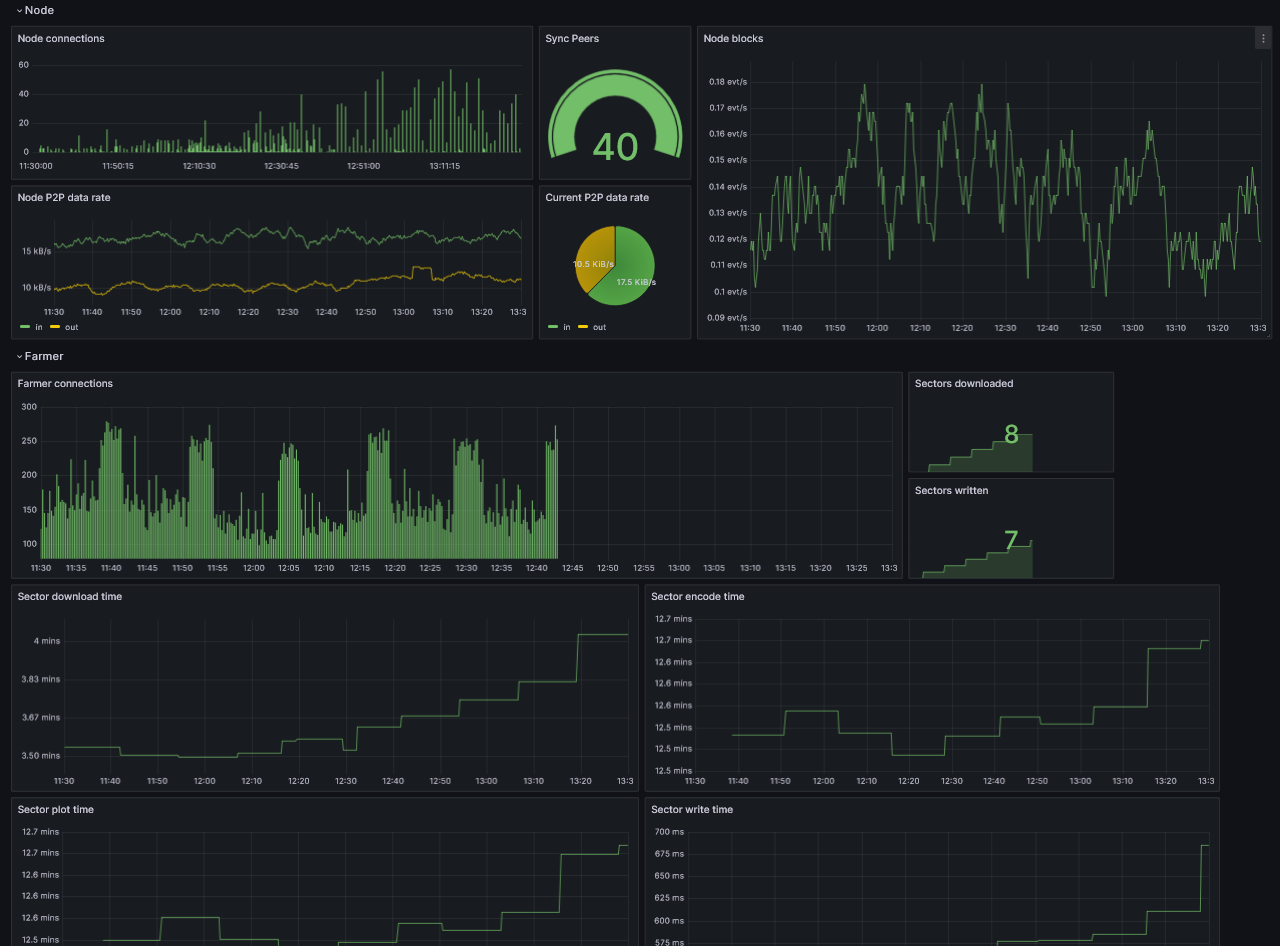
На этом этапе вы должны иметь возможность отслеживать свой узел.